
Here are October's release notes. If there is an overarching theme, it is that of personalization and visualization. With new table summaries, we allow you to create valuable home pages, dashboards, and catalog views. With FinOps integrations, we provide you with the data to make those views even more powerful.
Biggest
Create detailed dashboards with custom tables 🖼️
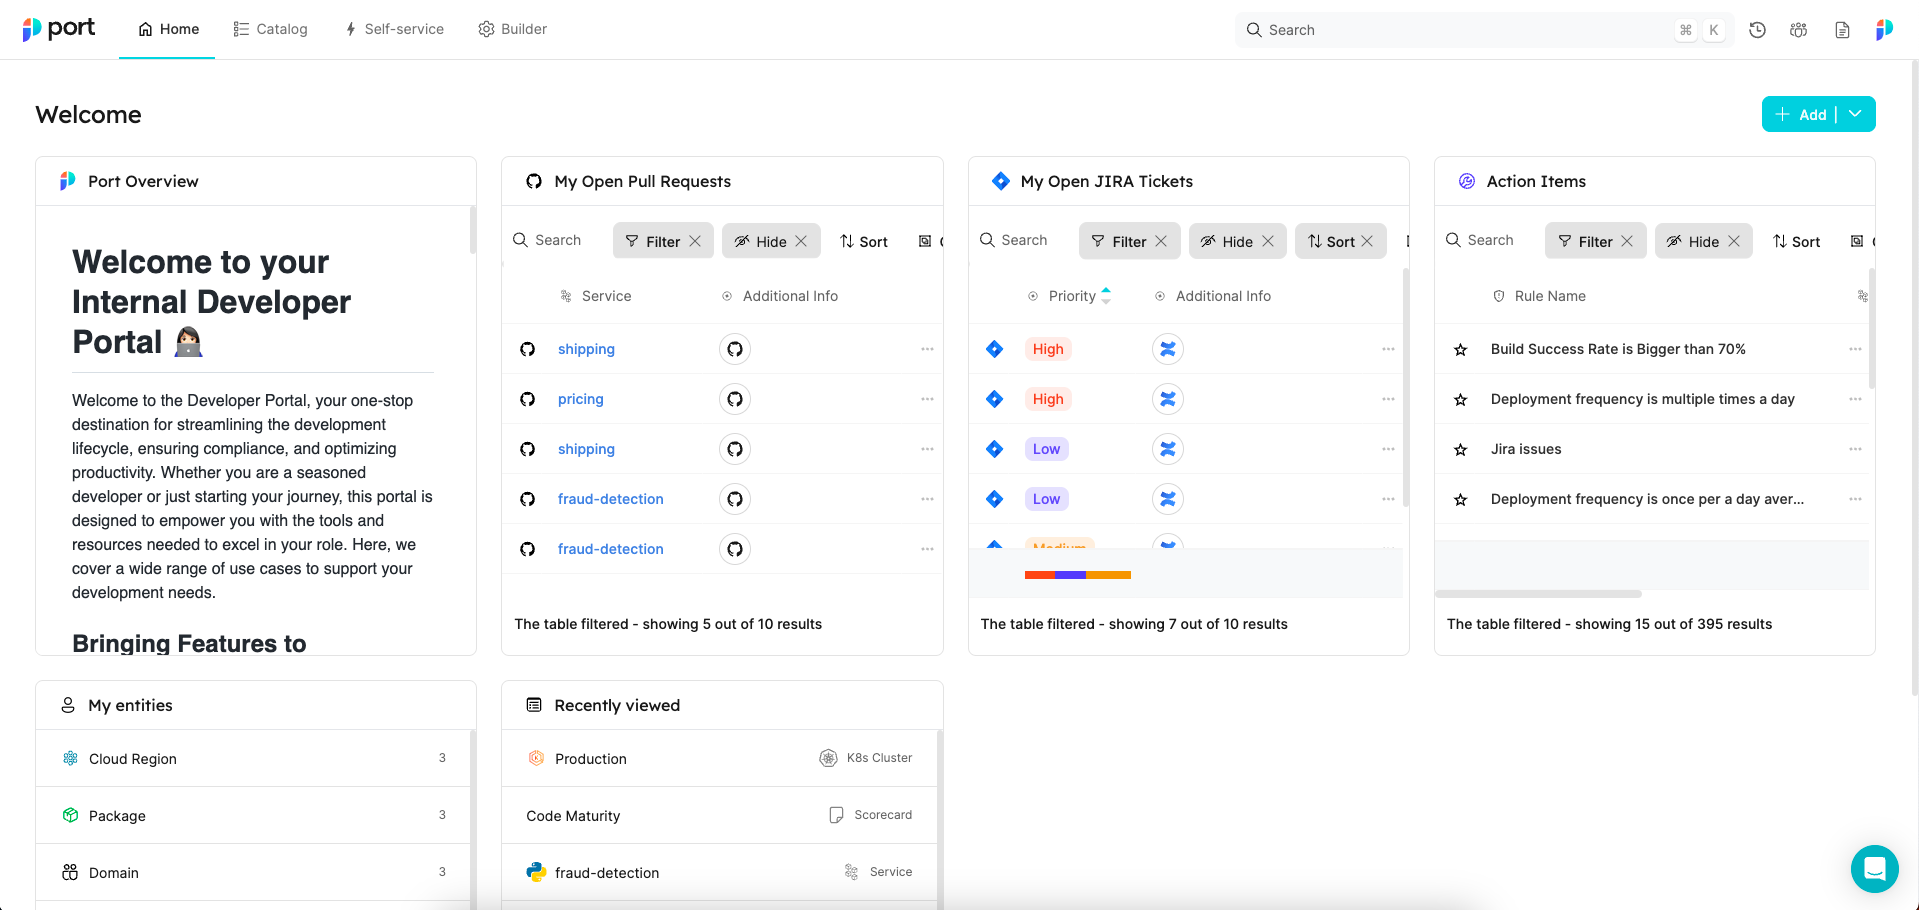
With the new table widget, you can display any catalog table in your dashboards by defining custom selections. For instance, a table widget can show all open pull requests or deployments from the last 24 hours. This provides a richer experience to developers and managers.
Visualize aggregated data with table summaries 📊
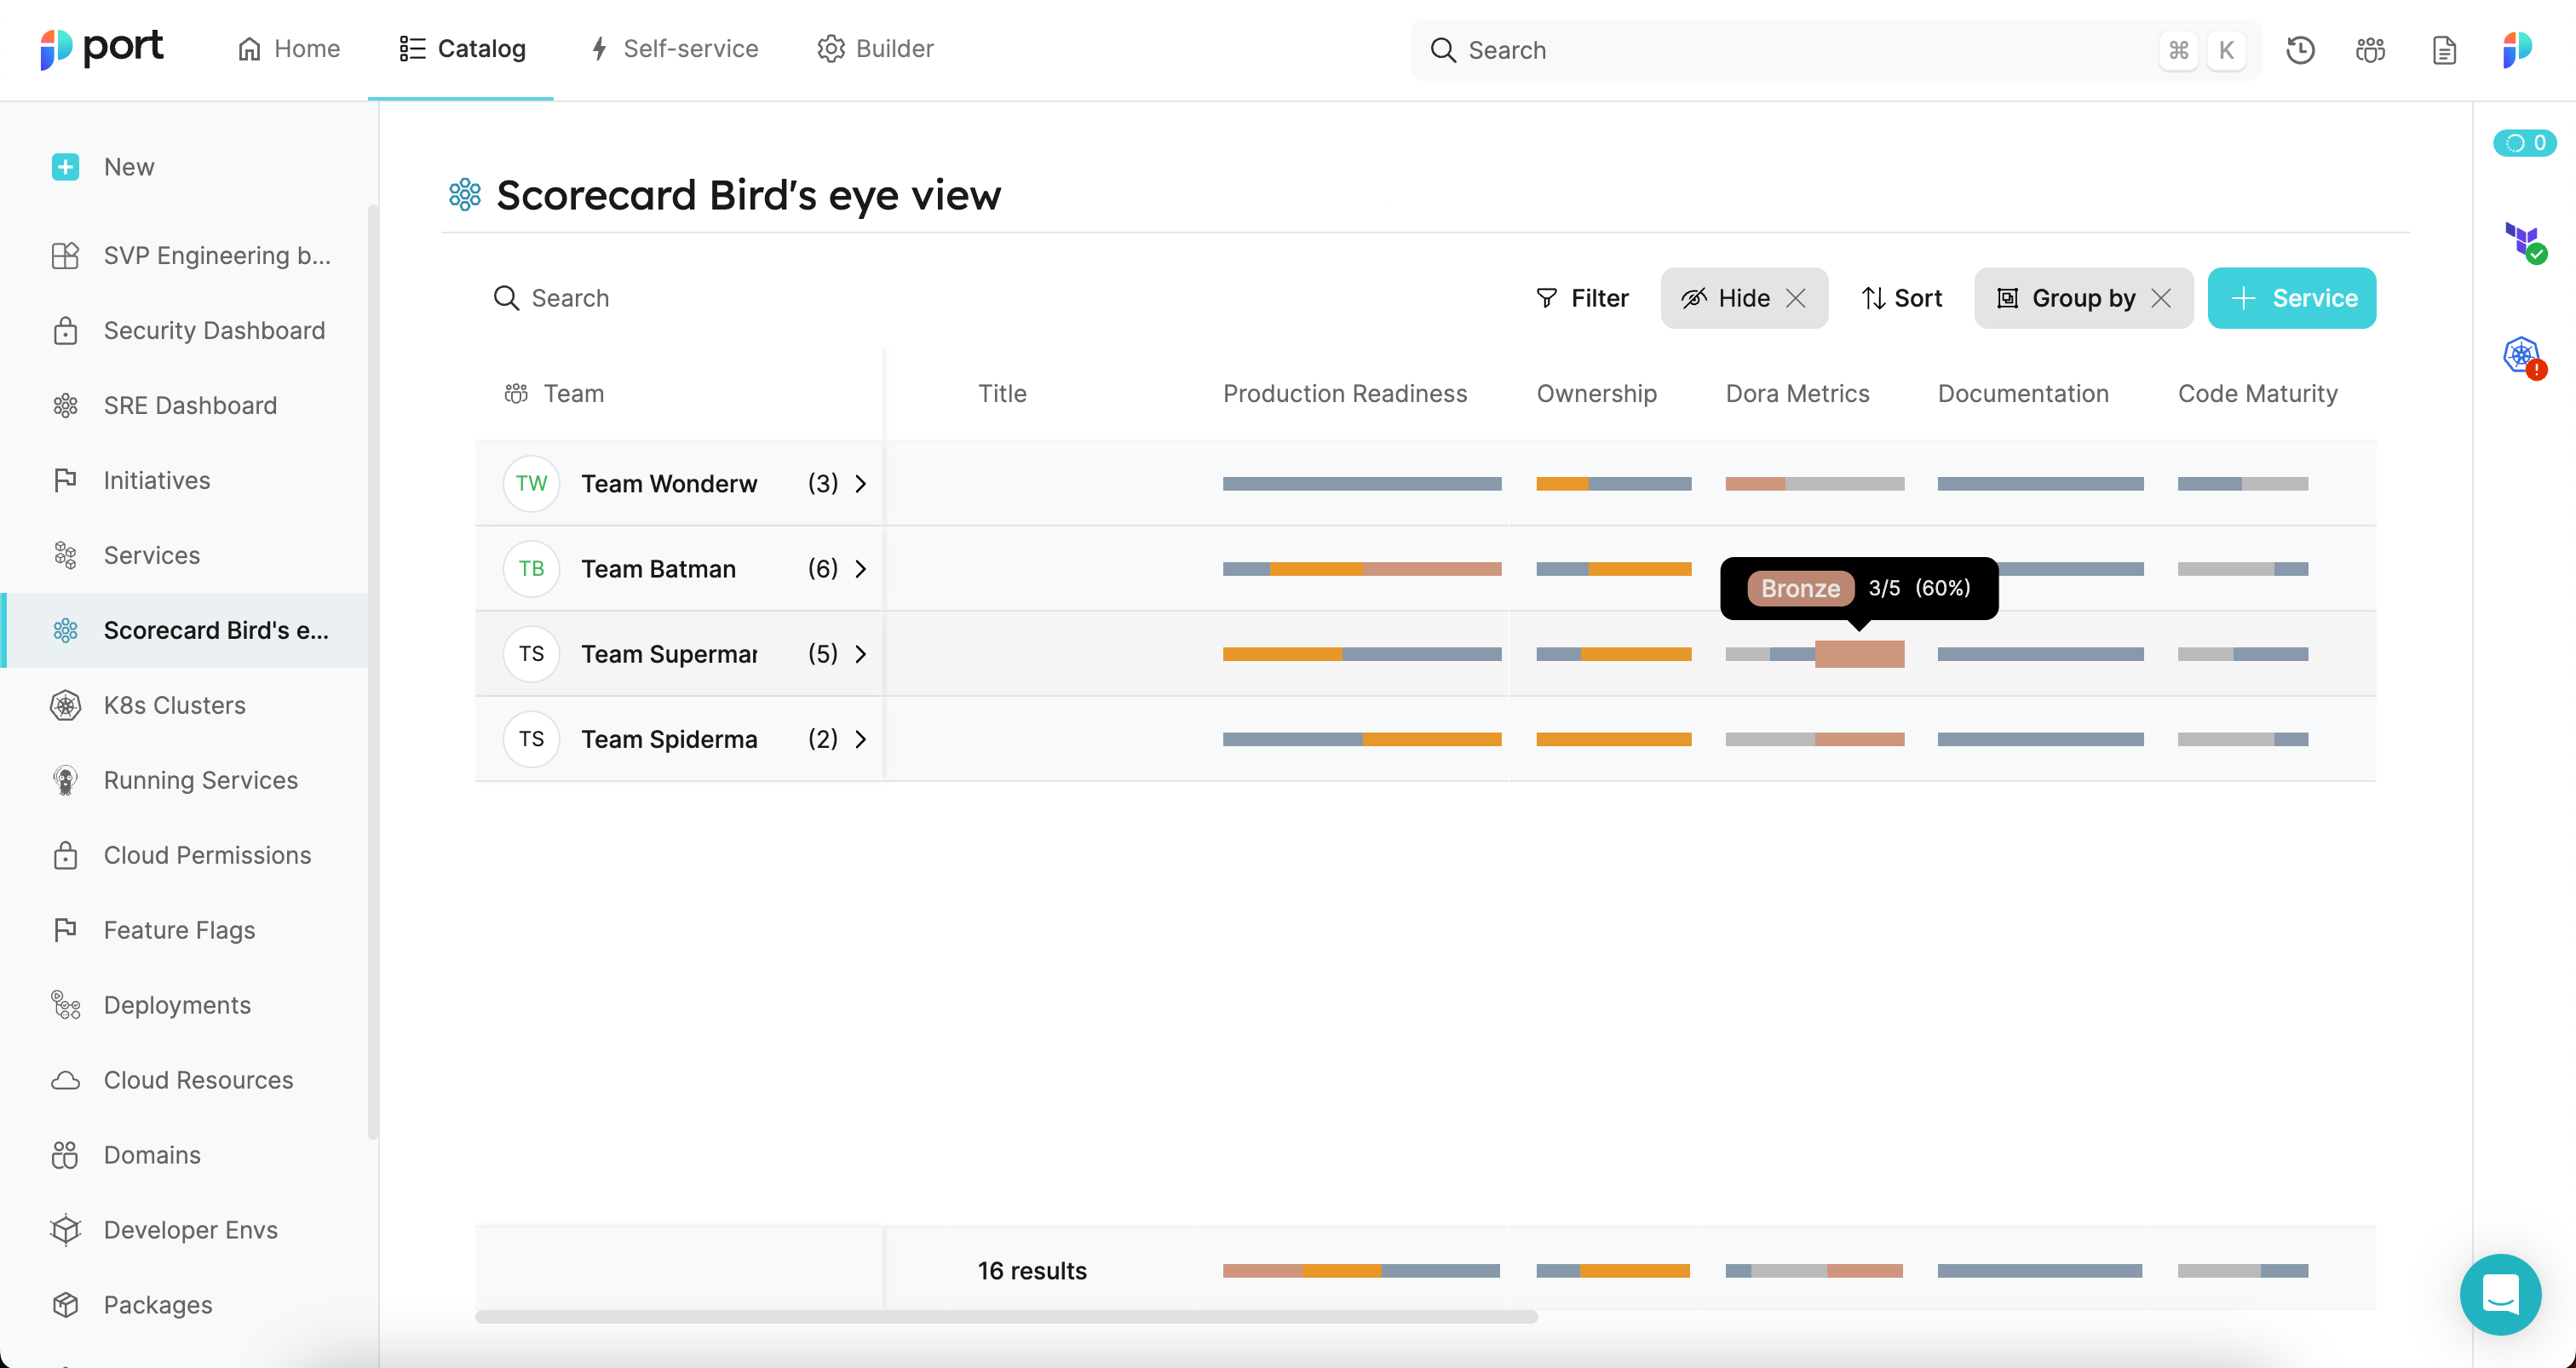
Using Table summaries you can add better data visualization to dashboards, catalog pages and developer/manager home pages.
Column summary - the bottom row of each table displays a summary of all values for each table column.
Group summary - when applying a "group by" to a table, each group will have summaries for that group for each table column.
This capability offers a quick and easy way to consume data, such as:
- Aggregated data views that answer questions like "How many Node services are in my organization/team?"
- High-level views for managers, team leaders, and developers, such as scorecard levels across services by team/domain, percentage of scorecard rules passed by team/domain, and more.
Table summaries are available in catalog pages and table widgets, as well as dashboards. The current version includes summaries for the following columns: Enum, Scorecards, and Scorecard rules. Stay tuned for more column types in the future.
Define accurate authorization conditions with dynamic permissions for self-service actions 🔑
You can now set action execution permissions according to your blueprint definitions. When configuring permissions to execute an action, the new capability can query the catalog to create a permission condition based on these queries. This enables scenarios such as:
- Allowing a developer to execute the "Deploy" action only if the developer is related to the same domain as the service.
- Allowing a user to execute the "Lock/unlock deployments" action only if the user appears in the catalog as the "team leader" of that service.
See how to define dynamic permissions.
Track and optimize costs using kubecost, opencost, and AWS cost reports 💰
We have added several cost management integrations:
- Kubecost and opencost - tools that allow measuring and allocating costs for Kubernetes and other cloud resources.
- AWS cost report - contains your resources bill details.
With these new integrations, you can easily bring cost data and incorporate it into your catalog by displaying it in different views and dashboards, enabling developers, teams, and managers to stay on top of costs in the organization at any level (service, team, domain, and more).
Personal tokens & access control 👤
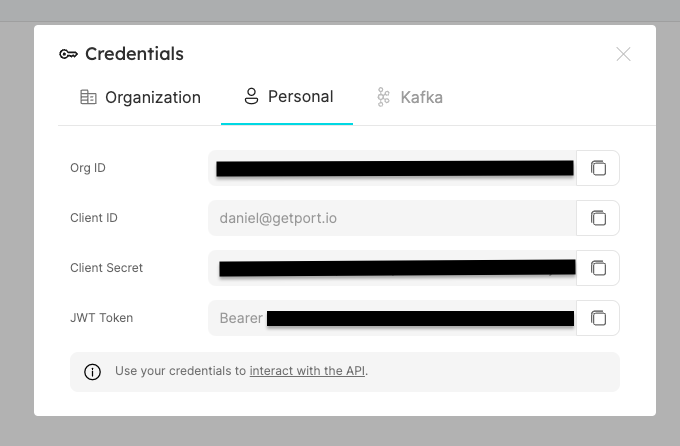
Any user can now generate an access token with their authenticated permissions, enabling anyone to have access control at the API usage level.
To generate a personal token, click on the menu button at the right side of the top navigation menu and click on “Credentials”.
--------------------------------------------------------------------
Mediums
Additional integrations
We have added more integrations that are powered by Ocean 🌊
- FireHydrant - incident management (install here, see docs here).
- Snyk - tracking code vulnerabilities (install here, see docs here).
- Sentry - APM & alerting (install here, see docs here).
- Kafka - event processing data (install here, see docs here).
Dynamic filters for widgets
When filtering the data of a widget, you can now reference user data (such as the user's team). This creates personalized user dashboards.
For example, create a "my open Jira issues" table that will contain only the logged-in user's open issues. This capability is available for all selection-based widgets (pie chart, number chart, and catalog table).
Guides and tutorials
To help you quickly get up and running with Port, we have created step-by-step guides for common use cases to implement in your developer portal.
Each guide covers an end-to-end developer routine, which can be used by your organization when completing it.
To view the guides, see the guides docs page or go to Port’s guides hub by going to the “Builder” page → click on “Guides” button at the top right of the page.
--------------------------------------------------------------------
Smalls
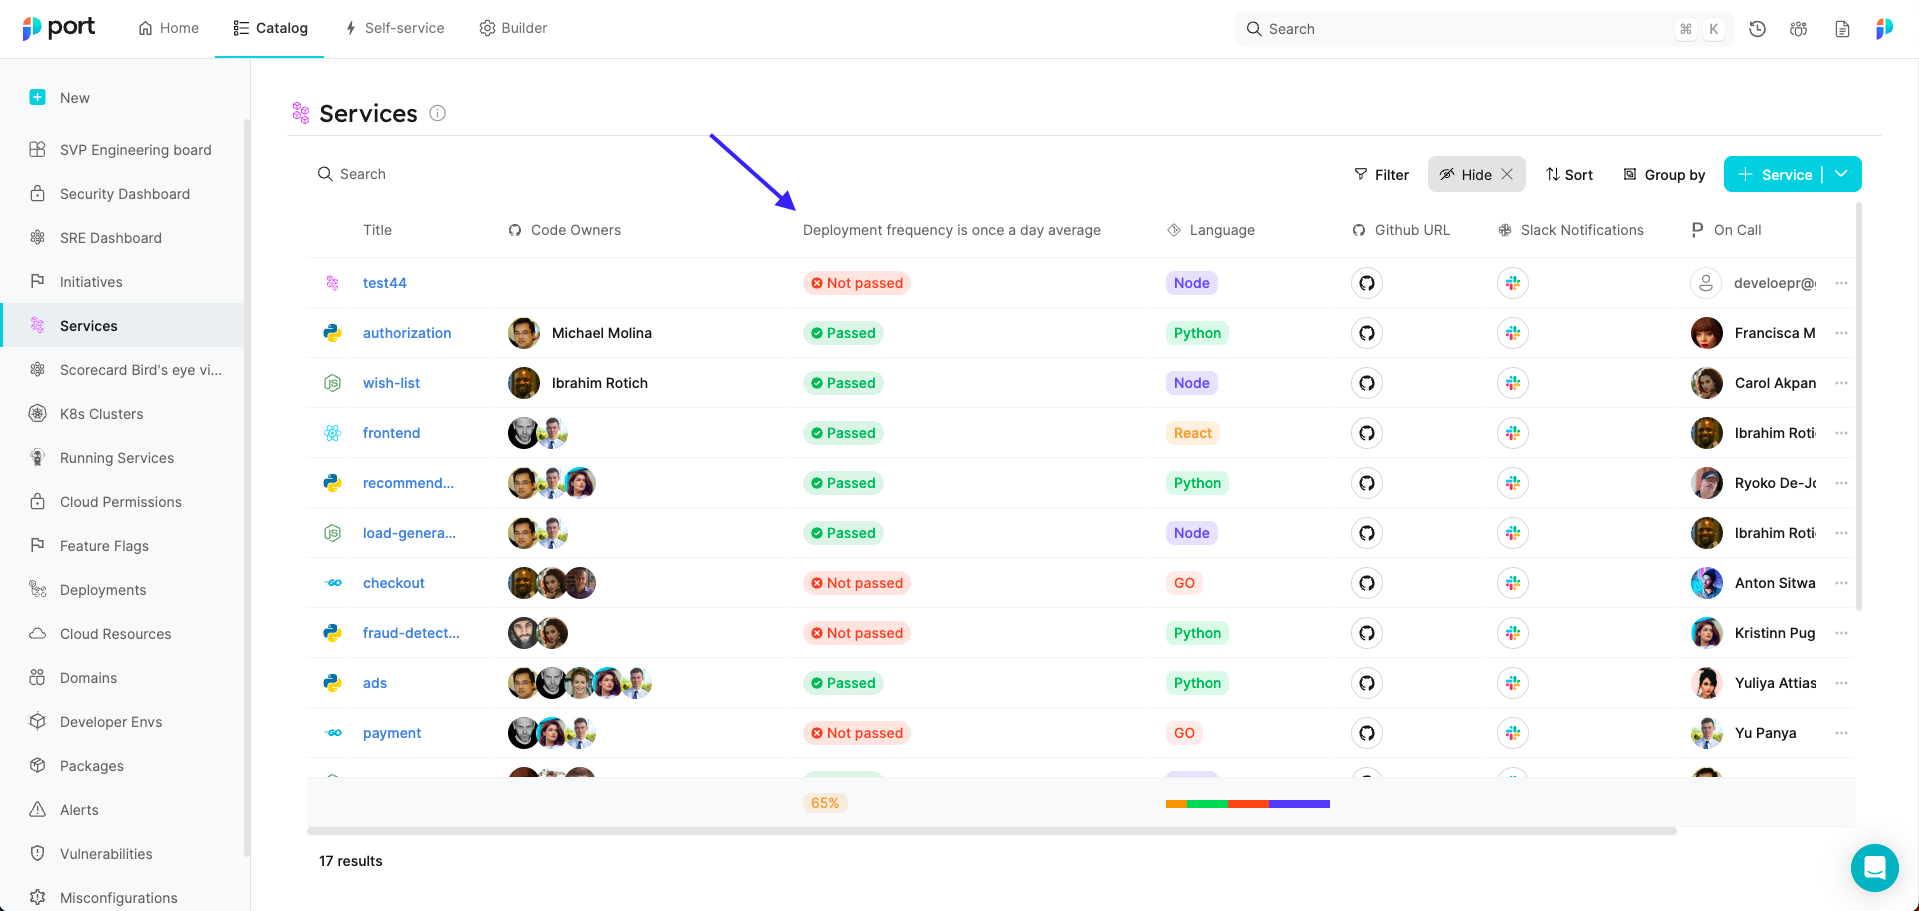
Display scorecard rules as table columns
Scorecard rules can now be displayed as table columns. This lets you create views focusing on improving specific parts of a scorecard and letting users drill down on scorecards easily right from the table.
GitLab - monorepo support
The GitLab integration allows exporting of specific folders into catalog entities. This new capability enables visualizing your monorepo services in Port.
GitHub - deployments and environments support
We have added the ability to export deployments and environments into catalog entities.